Posts Tagged infographic
Focus: 30 years of the Space Shuttle Program Celebrated, Infogragphed. To End.
Posted by mistergroonk in Holiday, Science, Space, USA on April 12, 2011

That fancy patch you see above is to celebrate the 30th anniversary of the Space Shuttle program and, sadly, its coming retirement.
On the morning of April 12, 1981, the shuttle Columbia, strapped to an enormous external fuel tank and a pair of solid rocket boosters, lifted off on its maiden voyage–and launched a new era in the Space Age. Never before had there been a spacecraft that could be used over and over again, that could land on Earth like an airplane–a glider, specifically.
That flight lasted 2 days, 6 hours, 20 minutes, and 53 seconds, in which time Columbia traveled 1.07 million miles, reaching an orbital altitude of 166 nautical miles. The two-man crew consisted of shuttle commander John Young and pilot Robert Crippen.
To date, the five spacecraft in the shuttle fleet have conducted more than 130 missions and traveled a cumulative half-billion miles–that’s a lot of commuting into Earth’s orbit and back.
- STS 1 Historical Press Kit (PDF)
- NASA’s Space Shuttle section
- When the space shuttle was new (photos)
Informative infographic below the cut.
Read the rest of this entry »
Infographic: The History of Content, Illustrated
Posted by mistergroonk in Art, Digital Share, History, Just Freaking Neat on March 9, 2011

The Sunday Punch: Evolution of the Batmobile Over 70 Years
Posted by mistergroonk in Art, Comics, Movies, Television on February 6, 2011
Design Boom reported on this info-graphic from carinsurance.org. The image is quite large so we dropped the entire bit below the cut.

Infographic: The History of ABC Animated
Posted by mistergroonk in Books, History, World on January 21, 2011
Below is a screencap of an animated gif denoting the history of ABC.
Click the image or here to see actual animation.

Thank You, Internet: Handy Chart Helps You Decide “Should I Work for Free?”
Posted by mistergroonk in Digital Share, Intertube Madness, Tutorials on January 18, 2011
As it was explained to us by the site itself:
hey there!
Who’s ready to stop working for free? Hopefully you are! If you have any doubts, consult this handy chart below. Start in the middle and work your way to your answer!
Click the image for the full size or the official link for the CSS version complete with Google translation.
Official site:
http://www.shouldiworkforfree.com/

“So You Found Something Cool on the Internet” or How Groonk.Net Works
Posted by mistergroonk in Comics, Intertube Madness, Just Freaking Neat on January 14, 2011

Infographic: The Business Card Printing Challenge has Been Met. 5 Online Printers Compared and Contrasted.
Posted by mistergroonk in Flickrlicious, Intertube Madness, Marketing, Versus on November 12, 2010
We’ve wanted to print out some handy business cards for a long time now. Too many years to count. Now we know that Moo cards were the right choice all along.
Now it’s time to get back in th habit of updating our Flickr.

via @kn0thing, printing choice
WATCH: David McCandless Talk the Beauty of Data Visualization. “Data is the New Soil”
Posted by mistergroonk in Art, Comics, Intertube Madness, Just Freaking Neat, Marketing on September 17, 2010
Here we present to you a delightful TED talk featuring journalist/programmer Davd McCandless.
When David McCandless began speaking of combing the language of the eye with the language of the mind the obvious connection came to us.
“It’s two languages working together at the same time.”
This is something comics readers have known forever. It’s no accident that data visualization works as a simple, yet complex, way to get useful information across efficiently.
Below the jump, some info-graphics featured in the TED Talk that stirred our curiosity.
Tumblr Watch: The Art of Chalkboards
Posted by mistergroonk in Art, Comics, Just Freaking Neat, Photography on September 2, 2010
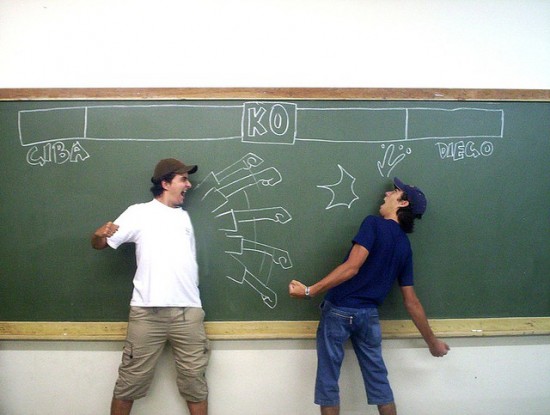
It’s a pity you’re denied our chalkboard instructional comic/Drama class presentation of the play The Importance of Being Earnest.
Official site:
http://theartofchalkboards.tumblr.com/
Our favorite from this selection may be the “Erase Your Fears” board below the jump.
Nuclear Detonation Timeline 1945-1998. That’s 2053 Nuclear Tests All Over the World
Posted by mistergroonk in On the French, USA, Video, World on August 3, 2010
Here you have your basic Nuclear Detonation timeline from recognized “Nuclear Weapon States.”
As the video starts out detonations are few and far between. The first three detonations represent the Manhattan Project and the two bombs that ended World War II. After a few representative minutes the USSR and Britain enter the nuclear club and the testing really starts to heat up.
Even though the video does not differentiate between sub-critical “safety” tests and full detonations, you get a good idea of the fever of the nuclear arms race.
Sleep well.
 Diesel Sweeties
- Is coffee a food, a drug, or –? April 25, 2022
- Johnny Wander
- Johnny Wander - BARBAROUS ½ - 32 November 5, 2026
- Pitch Black
- Karloff May 30, 2019
- XKCD
- Simulation November 6, 2026
Look Closer


- Geeks of Doom
- Book Review: A Feast For A Tenday: The Official Cookbook for Baldur’s Gate 3 (Dungeons & Dragons) Waerloga69
- Halloween Reads 2026: Recommendations For Spooky Season Books, Gifts & More Empress Eve
- Book Review: Travis Baldree’s Legends & Lattes: The Graphic Novel Empress Eve
- Book Review: Interview With The Vampire 50th Anniversary Edition By Anne Rice Empress Eve
- Naked Imagination
- The Old Man December 10, 2012
- When the eyes close December 10, 2012
- Nerdist
- Daft Punk Meets Marvel, E.T. and more in 2026 LEGO Holiday Ad November 6, 2026
- Disney Is Developing a Live-Action Medusa Film November 6, 2026
- Nick Holmes
- Thanks Internet; revisited. May 13, 2026
- Science! December 20, 2025
- Warren Ellis
- home August 13, 2020
- Wil Wheaton
- I wish I really were a Traveler of all of space and time. October 29, 2026
- in which i am turned into a little plushie thing October 27, 2026